IB Maths AI 2.8 Notes
This page contains our IB Maths AI notes for 2.8. By reading each one of these notes, you will fully cover the content for IB Maths AI 'Logarithmic graphs'.
Chapters
Scaling & linearising graphs
In this section, we use logarithms to make large or small data values easier to work with, and to transform curved relationships into straight lines. This helps us identify whether data follows an exponential model or a power model, and it makes the parameters easier to determine. Sometimes data values vary over a very wide range. In these cases, an ordinary linear scale may hide important features of the data. A logarithmic scale can make the graph easier to interpret. A logarithmic scale does not increase by equal differences. Instead, it increases by equal ratios. For example, marks at , , , and are equally spaced on a log scale because each value is times the previous one.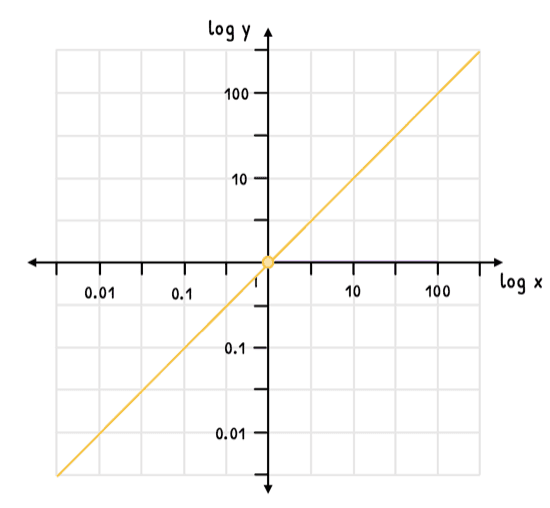
Logarithmic graphs help when ordinary graphs are difficult to read because:
- the data covers a very large range of values
- the data covers a very small range of values
- the main interest is the rate of growth rather than the absolute change
Thus, logarithmic graphs can:
- compress large ranges of data
- reveal patterns hidden on a linear scale
- turn curved relationships into straight lines
- make it easier to estimate parameters from data
They are especially useful in science, finance, and population modelling. For example, populations of bacteria, sound intensity, and earthquake magnitudes are often displayed using logarithmic scales.
A curved graph can sometimes be transformed into a straight line by taking logarithms. This process is called linearization.
Once a straight-line form has been created, the gradient and intercept can be used to find parameters in the original model.
The two main cases are exponential relationships and power relationships.
In this section, means logarithm base unless stated otherwise.
tibertutor.com
Next Up
You have completed the sub-topic 2.8 notes, covering "Logarithmic graphs" for IB Maths AI - continue with related resources below or explore the full IB Maths AI course from the IBO.
Other Sub-topic 2.8 resources