3 Examiner Checks That Win Marks in IB Biology Data Analysis
Choose your test by data type and group count: a t-test for two groups, one-way ANOVA for three or more, chi-squared for categorical counts, and Pearson or Spearman for correlation, switching to a non-parametric alternative whenever assumptions fail. Examiners want three things beyond the right test: an assumption check, a p-value, and an effect size (with a confidence interval where it fits). Practising against examiner-style questions, such as those provided on a comprehensive AP Biology Tutoring in Hillsborough, NJ platform, is what turns that knowledge into marks.
TL;DR:
- Correct test choice depends on whether data are continuous or categorical and the number of groups, with non-parametric alternatives used when assumptions fail.
- Assumption checks like normality, homogeneity of variance, and independence are essential before running the test, and must be documented clearly.
- Reporting should include the test statistic, degrees of freedom, p-value, effect size, and confidence interval to fully meet IB requirements.
- Practice should focus on examiner-created questions and mock exams to identify and fix common errors in assumption checks, test selection, and statistic reporting.
- Good experimental design involves clearly defining independent, dependent, and controlled variables to ensure appropriate test selection and valid results.
Table of Contents
- Which statistical test should you use for IB biology data analysis?
- How do you check assumptions before running a test?
- How do you report statistics to satisfy the IB mark scheme?
- What exam technique wins marks on data-based questions?
- What is the best way to practise IB biology data analysis?
- Why does examiner-authored practice matter for this criterion?
- How do you calculate and interpret descriptive statistics?
- How should you handle variables in your experimental design?
- How do you construct and interpret a confidence interval?
- How do you analyse qualitative or descriptive data?
- How do you run these tests on IB-approved software or calculators?
- Oliver’s practical study tips for making steady improvement
- Practise IB biology data analysis with examiner-built mock exams
- Sources
- FAQ
Which statistical test should you use for IB biology data analysis?
The test you choose depends on two questions: what kind of data have you collected, and how many groups are you comparing? Get this decision right before you touch a calculator, because examiners reward correct test selection as much as correct arithmetic.
- Two-group continuous data: use an independent t-test when the groups are separate (say, plant height under two light conditions). Use a paired t-test when you have before-and-after measurements on the same subjects, such as heart rate before and after exercise on the same participants.
- Three or more group means: use a one-way ANOVA followed by a Tukey post-hoc test. This replaces running several t-tests back to back, which inflates your chance of a false positive every time you repeat the comparison.
- Categorical counts: use a chi-squared goodness-of-fit test to compare observed frequencies against an expected ratio, or a chi-squared test of independence to compare two categorical variables. Switch to Fisher’s exact test when any expected cell count drops below 5.
- Correlation between two continuous variables: use Pearson’s correlation for linear relationships in normally distributed data, and Spearman’s rank correlation when the data are ordinal, skewed, or clearly non-linear.
- Non-parametric substitutes: Mann–Whitney U replaces the t-test for two groups, and Kruskal–Wallis replaces ANOVA for three or more, whenever your data will not meet normality requirements.
The IB Biology IA statistical tests guide sets this out as a straightforward decision flow: number of groups, multiplied by data type, gives you the correct tool. Memorise that logic rather than memorising individual test names in isolation.
How do you check assumptions before running a test?
Picking the right test is only half the job. You then need to confirm the data actually satisfy that test’s assumptions, and know what to do when they do not.
- Check normality. Use a Shapiro–Wilk test or a Q-Q plot on each group. If the data are clearly non-normal and your sample is small, switch to the equivalent non-parametric test rather than forcing a t-test or ANOVA through.
- Check homogeneity of variance. Levene’s test tells you whether your groups have comparable spread. If variances differ substantially, use Welch’s t-test instead of the standard two-sample t-test, or move to a non-parametric alternative if normality has also failed.
- Check independence. This is a design question, not a calculation. Repeated measurements on the same subject are not independent, which is exactly why paired tests exist. If your data violate independence and you use an unpaired test anyway, the result is invalid regardless of the p-value it produces.
- Check expected cell counts for categorical data. When any expected frequency in a chi-squared table falls below 5, the chi-squared approximation breaks down. Fisher’s exact test handles small samples correctly instead.
One sentence in your write-up, such as “normality was confirmed via Q-Q plot, allowing use of a parametric t-test,” satisfies the assumption-checking mark without eating your word count.
How do you report statistics to satisfy the IB mark scheme?
A correct test with a bare p-value earns partial credit at best. The Data Analysis criterion rewards a complete statistical picture: the test statistic, degrees of freedom, the p-value, an effect size, and a confidence interval where one is meaningful.
- Test statistic and degrees of freedom: report t or F with its df, exactly as your software or calculator outputs it, e.g. t(18) = 3.42.
- P-value: state it precisely rather than just “significant,” e.g. p = 0.003, and compare it against your stated alpha (usually 0.05).
- Effect size: Cohen’s d for t-tests, η² (eta squared) for ANOVA, or r² for correlations. This tells the reader how large the difference actually is, not just whether one exists.
- 95% confidence interval: include it when reporting a mean difference, since it shows the plausible range of the true effect rather than a single point estimate.
- Correlation specifically: report both r and r², and state what proportion of variance in one variable is explained by the other. An r² of 0.64 means 64% of the variation is accounted for, which is a far more useful sentence than “the correlation was strong.”
Why p alone falls short: a tiny p-value can come from a trivially small effect measured on a large sample, while a genuinely large effect can produce a modest p-value in a small IA dataset. Effect size and confidence intervals are what separate statistical significance from biological importance, and examiners are trained to look for both.
A model sentence to adapt: “There was a significant difference in [dependent variable] between [groups], t(df) = [value], p = [value], Cohen’s d = [value], indicating a [small/medium/large] effect.” Swap in your own numbers and biological context, and you have satisfied nearly every reporting line the mark scheme checks for.
What exam technique wins marks on data-based questions?
Under timed conditions, a fixed sequence stops you from missing easy marks. Run through this every time a data-analysis question appears on Paper 2 or Paper 3.
- Read both axes properly, including units and scale, before interpreting anything.
- Quote actual values from the table or graph rather than describing trends vaguely (“increased from 12.4 to 19.1 mm”).
- Name the test you would use or have used, and why it fits the data type and group count.
- State your assumption check in one sentence.
- Present the statistics: test statistic, df, p-value, effect size, CI where relevant.
- Interpret in one sentence, linking the numbers back to the biology being tested.
Three mistakes account for most lost marks: running multiple t-tests across three or more groups instead of an ANOVA, skipping the normality or variance check entirely, and reporting only a p-value with nothing else. Aim for three to five past-paper data questions a week, self-marked strictly against the official mark scheme rather than your gut sense of whether the answer “sounds right.”
Pro Tip: Keep a one-page error log across every practice paper. Write down the mistake, not just the correct answer. When “used t-test instead of ANOVA” shows up three times, you have found the exact gap costing you marks, and you can fix it in a single revision session rather than guessing.
What is the best way to practise IB biology data analysis?
A weekly routine beats sporadic cramming for this criterion, because statistical fluency comes from repetition against real exam formats, not from re-reading a formula sheet.
- Do three focused data-based questions each week, mark them against the official rubric, log every error, then spend twenty minutes revising the one statistical method that tripped you up.
- Use spreadsheet functions (a standard t-test or ANOVA formula) to check your working, and plot your data first so you can visually spot outliers or skew before choosing a test.
- Generate your own practice datasets from simple classroom experiments (germination rates under different light levels, enzyme activity at varying temperatures) to build IA-style data without waiting for a formal practical.
- Prioritise examiner-authored practice over generic worksheets, since only genuine mark-scheme material shows you exactly how marks are awarded for assumption checks and effect-size reporting.
Tiber Tutor’s test builder lets you assemble focused sets of data-analysis questions rather than working through an entire mixed paper every time, and its mock exams pair each question with examiner-authored answers so you can see precisely where marks were gained or lost.
Why does examiner-authored practice matter for this criterion?
Data Analysis is one of the few IB criteria with a genuinely learnable structure: correct test, checked assumptions, complete reporting. A questionbank and mock exams written by working IB examiners provide mark-scheme feedback that tells you exactly which of those three elements you missed, rather than leaving you to guess from a generic answer key. Combined with syllabus monitoring and analytics that flag your weakest statistical methods, that examiner lens is what turns repeated practice into a rising Paper 3 score.
How do you calculate and interpret descriptive statistics?
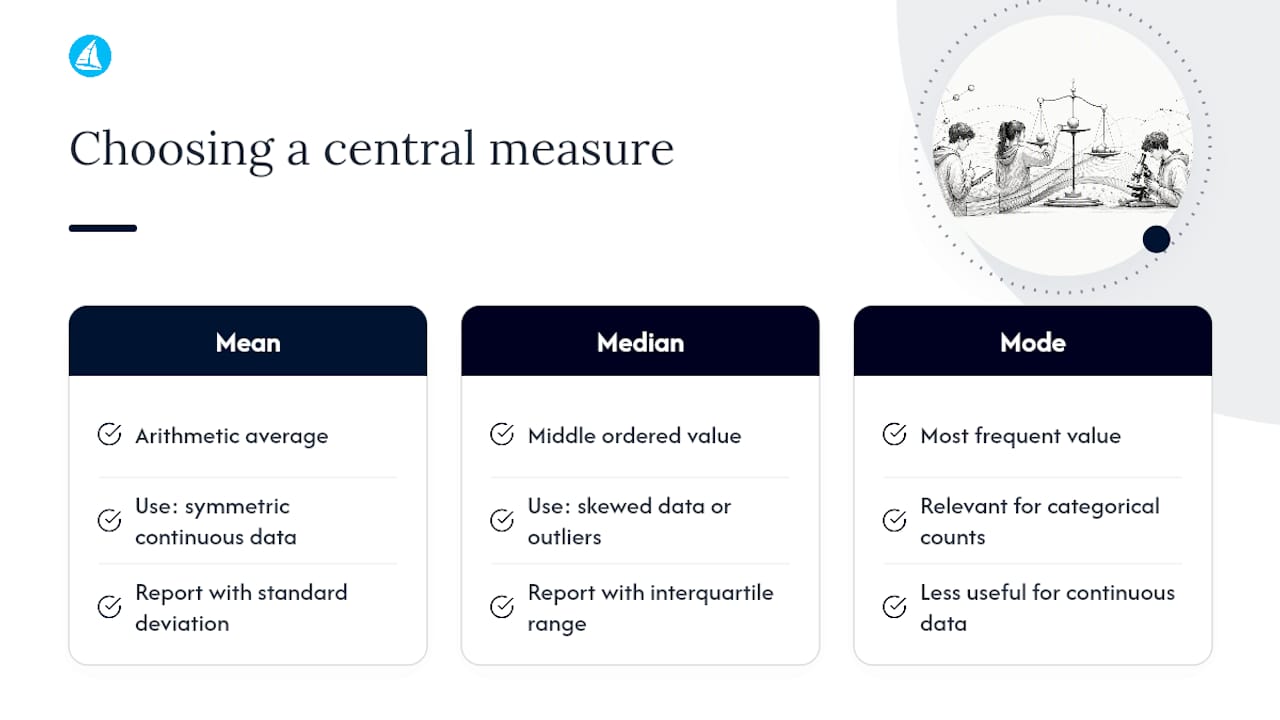
Before running any inferential test, every IA and most data-based exam questions expect you to summarise the raw numbers correctly. Mean is the arithmetic average, and it is the right measure for symmetric, continuous data such as leaf length or reaction time. Median, the middle value once data are ordered, is more honest when your dataset has outliers or a skewed distribution, which happens often in small IA samples. Mode, the most frequent value, matters far less in continuous biological data but can be relevant for categorical counts.
Standard deviation and variance describe spread rather than centre. Variance is the average squared deviation from the mean; standard deviation is its square root, which puts the figure back into the original units (mm, seconds, mg) so it is actually interpretable. A small standard deviation relative to the mean signals tight, repeatable data; a large one signals variability that might come from genuine biological difference, measurement error, or too small a sample.
Report mean plus standard deviation together, never the mean alone, since a mean without a spread measure tells an examiner nothing about how reliable your data collection was. When your data are skewed, report the median alongside the interquartile range instead of forcing a mean and standard deviation onto a distribution they do not fit. This choice, made correctly, often earns marks before you even reach the inferential statistics section of a question.
How should you handle variables in your experimental design?
Every statistical test rests on a clear separation of three variable types, and getting this wrong at the design stage undermines everything downstream. The independent variable is what you deliberately change (light intensity, temperature, substrate concentration). The dependent variable is what you measure in response (growth rate, enzyme activity, oxygen production). Controlled variables are everything else you hold constant so the result can be attributed to the independent variable alone: pH, volume, species, incubation time.
Weak IA design usually shows up as an incomplete controlled-variables list, which examiners read as a sign the causal link between independent and dependent variable is not actually secure. A strong design states each controlled variable alongside how it was controlled, not just that it was controlled: “temperature held at 25°C using a water bath” carries more weight than “temperature was controlled.”
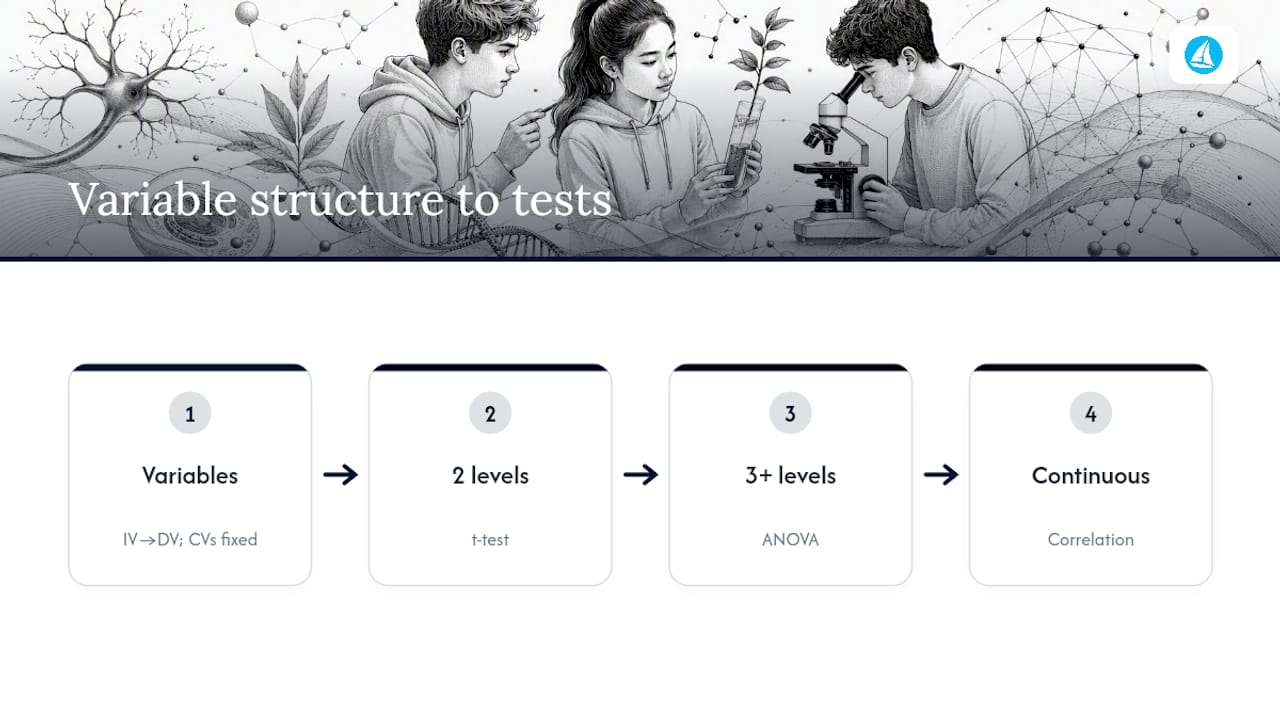
This matters directly for test choice too. An independent variable with two levels naturally suggests a t-test; three or more levels point towards ANOVA; a continuous independent variable measured alongside a continuous dependent variable points towards correlation. Getting the variable structure right at the design stage, before data collection even begins, is what makes the statistical test choice almost automatic later. Examiner reports consistently note that the strongest IAs plan their statistical approach into the method section rather than choosing a test retrospectively once the data are in hand.
How do you construct and interpret a confidence interval?
A 95% confidence interval gives the range within which the true population mean (or true mean difference) is likely to fall, based on your sample. For a single mean, it is calculated as the sample mean plus or minus the margin of error, where the margin of error depends on the standard error of the mean and a critical value from the t-distribution.
In practice, most exam boards accept the interval as calculated by your spreadsheet or calculator function, so the marking focus is on interpretation rather than manual computation. A narrow interval signals a precise estimate, usually because sample size was reasonably large or variability was low. A wide interval signals an imprecise estimate, which is common in small IA samples with only five or six replicates per condition.
The interpretation that earns marks links the interval back to biological meaning: “the 95% CI for the difference in mean growth rate was 2.1 to 5.8 mm, indicating we can be 95% confident the true difference lies within this range, which does not include zero, supporting a genuine treatment effect.” That last clause, noting whether zero falls inside or outside the interval, is what tells an examiner you understand what the interval is actually doing, not just that you can quote a range from software output.
How do you analyse qualitative or descriptive data?
Not every IB Biology dataset is numerical. Observational data such as animal behaviour categories, colour changes in an indicator, or presence/absence of a structure under a microscope still need structured analysis, even without a p-value attached.
The first step is converting qualitative observations into categorical counts wherever possible, since that reopens the door to chi-squared testing. If you recorded “leaf colour: green, yellow, brown” across treatment groups, tallying frequencies per category turns a descriptive observation into data a chi-squared test of independence can evaluate.
Where conversion to counts is not sensible, such as free-text observations of behaviour, use a coding scheme: define clear categories in advance, apply them consistently across your whole dataset, and report inter-observer reliability if more than one person collected the data. This is a common weak point in IA work, since inconsistent coding between sessions undermines the reliability of everything that follows. State your coding criteria explicitly in the method, and treat consistency as seriously as you would treat controlling a continuous variable.
How do you run these tests on IB-approved software or calculators?
The IB does not mandate a specific tool, so the workflow below works whether you use a graphing calculator or a spreadsheet, and both are accepted in coursework and, where calculators are permitted, in the exam room itself.
- Enter your raw data into lists or columns, one per group or variable, keeping units consistent.
- Select the correct built-in function for your chosen test, whether that is a two-sample t-test, one-way ANOVA, or chi-squared function, matching the decision you made in the earlier test-choice step.
- Check the assumption inputs first, such as confirming variance equality if your software asks you to specify equal or unequal variances for a t-test.
- Run the test and record every output value: the test statistic, degrees of freedom, and p-value, not just the final significance verdict.
- Calculate effect size separately, since most calculator functions do not output Cohen’s d or η² automatically; you typically need a short manual calculation from the means and standard deviations already generated.
- Cross-check with a graph (box plot or scatter plot) to confirm the statistical result matches what the data visually show, catching any data-entry errors before you write up the result.
Guided walkthroughs for running a t-test on a graphing calculator and for running a t-test in a spreadsheet both follow this same sequence, which is worth practising until it becomes automatic under exam time pressure.
Oliver’s practical study tips for making steady improvement
Twenty minutes a day beats a single three-hour weekend session, every time. Do one worked data-analysis question, check it against the actual mark scheme rather than your instinct, and note one specific thing to fix. Split your revision roughly evenly between content and data-analysis practice; students who only revise content tend to freeze the moment a statistics question appears on Paper 3. Marked mocks and analytics matter because they show you patterns across weeks, not just whether one paper went well.
— Oliver
Practise IB biology data analysis with examiner-built mock exams
This revision platform provides exam-style data-analysis questions written and mark-schemed by real IB examiners, so every practice attempt tells you precisely where you lost marks and why.

The IB Biology Tests collection pairs exam-style questions with examiner-authored answers, full mock exams, and progress analytics that flag exactly which statistical method (t-test, ANOVA, chi-squared, correlation) is costing you the most marks across your practice history. That interlinked structure, questions tied to mock papers tied to analytics, is not something a standalone worksheet or PDF mark scheme can offer. A free 7-day trial gives you access before you commit to a subscription, so start with a mock data-analysis set on the IB Biology Tests page and see exactly where your Data Analysis criterion stands right now.
Sources
- IB Biology IA Statistical Tests 2025 — t-test, ANOVA, Chi-squared Guide | Cerebrum Biology Academy
- Statology — t-test in Google Sheets
FAQ
Is it hard to get a 7 in IB Biology?
A 7 demands consistent accuracy across content recall, extended-response writing, and data analysis, so most students who fall short lose marks specifically on statistics reporting rather than content knowledge. Deliberate practice against mark schemes, particularly for the Data Analysis criterion, closes that gap faster than further content revision alone.
What are the hardest topics in IB Biology?
Students most often struggle with statistical analysis and experimental design, alongside biochemistry-heavy topics like enzyme kinetics and cellular respiration, because both demand applying numerical reasoning to biological concepts rather than pure recall. Regular practice with examiner-style data questions, such as those on Tiber Tutor, directly targets this weak point.
What percentage is a 7 in IB Biology? It varies slightly each exam session and differs between Standard Level and Higher Level. There is no single fixed percentage that applies every year. The IBO’s official biology curriculum page and your school’s most recent grade boundary documents are the accurate source for the current session.
Grade boundaries shift slightly each exam session and vary between Standard Level and Higher Level, so there is no single fixed percentage that applies every year. The IBO’s official biology curriculum page and your school’s most recent grade boundary documents are the accurate source for the current session.
Is AP or IB Biology harder?
The two courses assess differently rather than one being simply harder: AP Biology leans more heavily on breadth of content recall, while IB Biology places sustained weight on data analysis, experimental design, and the Internal Assessment, which rewards statistical reasoning that AP does not test to the same degree. Students who find data interpretation difficult tend to feel IB Biology is the more demanding of the two.
Which statistical test should I use for my IB Biology IA?
Match the test to your data type and group count: a t-test for two groups, one-way ANOVA for three or more, chi-squared for categorical counts, and Pearson or Spearman for correlation. The IB Biology IA statistical tests guide sets out this decision flow in more detail, and planning the test into your method section before data collection avoids the most common IA penalty.