IB Teacher Dashboards That Link Vendor Features to Classroom Workflows
IB teacher dashboards centralise Internal Assessment, Extended Essay, and Core submission tracking into one roster view, giving teachers and coordinators live visibility over class coverage and at-risk students. They flag pending, submitted, and overdue work automatically, cutting the manual spreadsheet work coordinators have relied on for years. They do not replace the official IBIS submission process, which still has to happen through the IB’s own systems.
TL;DR:
- Centralized dashboards significantly reduce manual tracking by automatically flagging pending, overdue, and submitted student work across all assessment components.
- Features like role-based filtering, file linking, and audit logs are crucial for efficient monitoring and maintain compliance during IB reviews.
- Daily teacher workflows involve assigning tasks, real-time monitoring, linking submissions, and triaging red flags to address issues early.
- School-wide coordinators benefit from continuous, filtered views that identify at-risk students weeks earlier than traditional spreadsheet reports.
- A dashboard’s effectiveness depends on clear indicators, user-specific actions, and an audit trail, which are highly valued by examiners for moderation and process validation.
Table of Contents
- What do IB teacher dashboards actually do?
- What features matter most in an IB teacher dashboard?
- How does a teacher use a dashboard day to day?
- How do coordinators use dashboards school-wide?
- What does the research say about good dashboard design?
- How do you choose and roll out a dashboard at your school?
- An examiner’s view on what actually matters here
- Where Tibertutor fits alongside your dashboard
- Where to check the details yourself
- Sources
- FAQ
What do IB teacher dashboards actually do?
An IB teacher dashboard’s job is simple to state and genuinely useful in practice: pull every student’s submission status into one screen, so nobody has to chase it manually. Instead of opening ten separate folders to check who has submitted their Internal Assessment draft, a teacher sees the whole class roster at a glance, colour-coded by status.
The stronger platforms, ManageBac’s eCoursework dashboard among them, build this around a few consistent capabilities:
- Centralised tracking of IA, EA, and Core progress across the whole cohort, not just one subject
- Role-based views filtered by grade, subject group, or homeroom, so a Head of Science sees only what’s relevant to them
- File linking that ties uploaded student work to the specific IB upload requirement it satisfies, creating an audit trail
- Cohort and component-level trend views that show how a class or year group is performing against prior cycles
- Fewer manual spreadsheets and earlier warning signs when a student is falling behind
That last point is where the practical value sits. A coordinator who used to build a submission tracker by hand each term now gets it built automatically, and gets it earlier in the assessment cycle, when there’s still time to intervene.
What features matter most in an IB teacher dashboard?
Not every dashboard earns its place in a school’s workflow. Some are genuinely built around IB requirements; others bolt generic gradebook features onto a DP label and hope nobody checks the detail. Here’s what to look for:
- Submission coverage indicators that show pending, submitted, and overdue status at a glance, ideally supporting multiple upload requirements per task (drafts, final files, reflection forms).
- Teacher-level actions built into the dashboard itself, letting a teacher link, reassign, or validate a student’s file without leaving the screen.
- Filters and search by student, class, subject, or homeroom, so a coordinator managing 200 students isn’t scrolling endlessly.
- Permission controls that separate what a subject teacher sees from what a DP coordinator sees.
- Gradebook and rubric integration, plus multi-year trend visualisation so this year’s cohort can be measured against last year’s.
- Export functions and audit logs, which matter enormously when a school needs to demonstrate compliance during an IB site visit or internal review.
Pro Tip: Ask any vendor for a live demo of the audit log before signing anything. A dashboard that shows status but can’t show a timestamped history of who changed what, and when, will leave your coordinator exposed the first time a submission is disputed.
How does a teacher use a dashboard day to day?
The daily workflow is where a dashboard either saves time or just adds another login to check. A well-built one follows a fairly predictable sequence:
- Assign the task. The teacher creates or links the IA, EA, or Core component to the class roster, and the dashboard immediately shows coverage: how many students have an assigned task versus how many still need one.
- Monitor submissions as they come in. Status indicators update in real time, usually with a popover showing exact submission dates and any missing components.
- Assess and link files. Once work is submitted, the teacher links each file to its correct IB upload requirement, and the system validates the file type against what IBIS expects.
- Search, reassign, and correct. If a student submitted the wrong file or needs a resubmission slot, the teacher searches their name and fixes the link directly, rather than emailing IT.
- Use the class-level indicator to triage. Anyone still flagged red near a deadline becomes the day’s priority, and that same flag feeds straight into the coordinator’s own view.
Understanding what Internal Assessment actually requires makes this workflow far easier to run, because teachers know exactly which components need linking and which are optional.
How do coordinators use dashboards school-wide?
A DP coordinator’s job is different in scale, not in kind. Where a teacher watches one class, a coordinator watches the whole cohort, often across several subject groups and homerooms at once. The dashboard needs to support that wider lens without becoming unreadable.
- Filtered roster views that surface every pending or overdue submission across the school in a single pass
- The ability to create a missing task directly from the dashboard and flag the responsible teacher, rather than sending a separate email
- Permission tiers, typically full access, homeroom-only, or no access, configured per staff role so sensitive student data stays restricted
- Multi-year and cohort trend data used to decide where CPD or extra departmental support is genuinely needed
Coordinators who rely on this kind of school-wide view tend to catch at-risk students weeks earlier than those still working from termly spreadsheet exports, simply because the flags update continuously rather than at fixed reporting intervals.
What does the research say about good dashboard design?
Academic research on teacher-facing dashboards is fairly consistent on what actually helps in a classroom setting, and it lines up closely with what the better commercial platforms have built. A design-principles paper presented through the International Society of the Learning Sciences argues that effective teacher dashboards need to support in-class learning directly, keep teacher cognitive overhead as low as possible, and make the next action obvious rather than burying it behind extra clicks.
That research maps closely onto features already common in IB eCoursework tools:
- Upload-linking and file validation operationalise the “reduce overhead” principle by removing manual file-checking
- Status popovers with due dates satisfy the “make the next action obvious” principle directly
- Component-level breakdowns, the kind The Datafied Classroom’s IB Exam Dashboard builds around, support the “actionable visualisation” idea by showing exactly where a cohort is weak
The consistent theme across vendor documentation is that linking files to IB upload requirements, rather than storing them loosely, is what turns a folder of documents into a genuine audit trail.
How do you choose and roll out a dashboard at your school?
Picking the right tool matters less than picking it for the right reasons, and rolling it out badly can undo even a strong choice.
- Build an evaluation checklist first: confirm must-have features, integration with your existing gradebook, a clear permission model, and exportable reports before you look at price.
- Pilot with one department for a term, tracking a minimum set of metrics: submission coverage rate, time-to-flag for overdue work, and teacher-reported ease of use.
- Train by role, not generically. A subject teacher needs five minutes on linking files; a coordinator needs thirty on permission settings and audit exports.
- Scale once the pilot metrics hold up, not before.
Pro Tip: The most common rollout failure isn’t the software itself, it’s overcustomising permission settings in month one. Start with the vendor’s default roles and tighten only where a genuine problem appears.
Avoid ignoring the audit trail during setup. It’s the feature nobody misses until an IBIS query lands on the coordinator’s desk with no history to point to.
An examiner’s view on what actually matters here
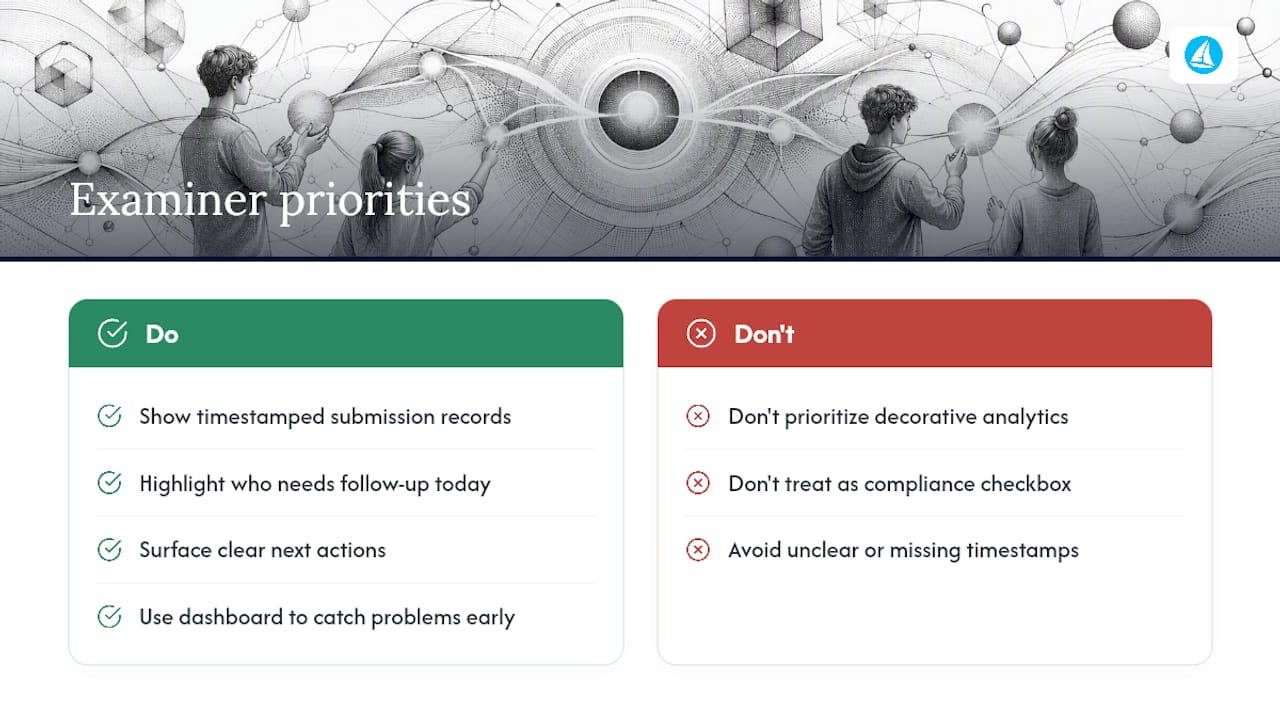
Having marked IB work across several cycles, what strikes me most about dashboards isn’t the analytics, it’s the audit trail. Examiners care about defensible process. A dashboard that shows a clean, timestamped record of when work was submitted and linked matters more, in a moderation dispute, than any prettier chart.
Usability matters too, but usability in service of a clear next action, not usability as decoration. The best dashboards make it obvious who needs following up today. Treat them as a tool for catching problems early, not a compliance box to tick, and they’ll earn their place in your workflow rather than just adding another login to check.
— Oliver
Where Tibertutor fits alongside your dashboard
A submission dashboard tells you who has handed work in. It doesn’t tell you whether that student actually understands enthalpy calculations or command terms in Paper 2 essay questions, and that gap is exactly where Tibertutor sits. Built by practising IB examiners, Tibertutor pairs exam-style questions, syllabus monitoring, and Two Week Mastery Targets with an AI-driven test builder across Biology, Chemistry, Physics, and Maths, giving teachers examiner-authored diagnostics that no submission tracker generates on its own.
Where a coordinator’s dashboard flags that a student is behind, Tibertutor shows exactly which syllabus points are weak and builds targeted revision around them, the kind of granular, exam-reflective analytics that generic LMS tools simply don’t offer. Schools can licence the All-Access Plan for $19 per month or a single-subject option through the Per-Subject Plan at $9 per month, both starting with a free trial. If your school already tracks submissions well, the next step is making sure students actually pass what they submit. Explore the IB Biology exam tests to see the analytics in action.
Where to check the details yourself
For readers who want to verify features directly rather than take a summary on trust:
- ManageBac’s eCoursework Dashboard help page for submission and file-linking documentation
- The ISLS design-principles paper for the academic basis behind dashboard UX choices
- The Datafied Classroom’s IB Exam Dashboard for cohort and component-level trend screenshots
- Simple Virtual Tour’s student engagement checklist for follow-up strategies once a dashboard flags a disengaged student
Sources
- IB Diploma eCoursework Dashboard – ManageBac+ Help Centre
- Design principles for teacher dashboards to support in-class learning — ISLS Repository
- IB Exam Dashboard — The Datafied Classroom
FAQ
What is a teacher dashboard?
A teacher dashboard is a centralised digital screen that shows submission status, class coverage, and performance trends for a group of students, replacing manual spreadsheets with live, filterable data.
What are the four types of dashboards?
Education dashboards typically fall into four categories: student-facing progress dashboards, teacher-facing class dashboards, coordinator or admin dashboards for school-wide monitoring, and analytics dashboards focused on cohort trends over time.
Do IB teacher dashboards submit coursework to the IB directly?
No. Dashboards like ManageBac’s eCoursework tool organise and link files to IB upload requirements, but schools must still complete the official submission through IBIS.
How much does Tibertutor cost for teachers?
Tibertutor offers an All-Access Plan at $19 per month and a Per-Subject Plan at $9 per month, both listed on the pricing page, with a free trial available before committing.
What is the 80/20 rule in teaching?
In teaching contexts, the 80/20 rule generally suggests focusing the bulk of instructional and monitoring time on the roughly 20% of students or tasks most likely to affect overall outcomes, such as students flagged as at-risk on a coordinator dashboard.