IB Biology practical skills explained: your 2026 guide
12 min readOliver Kidd (Co-founder)4 Jul 2026
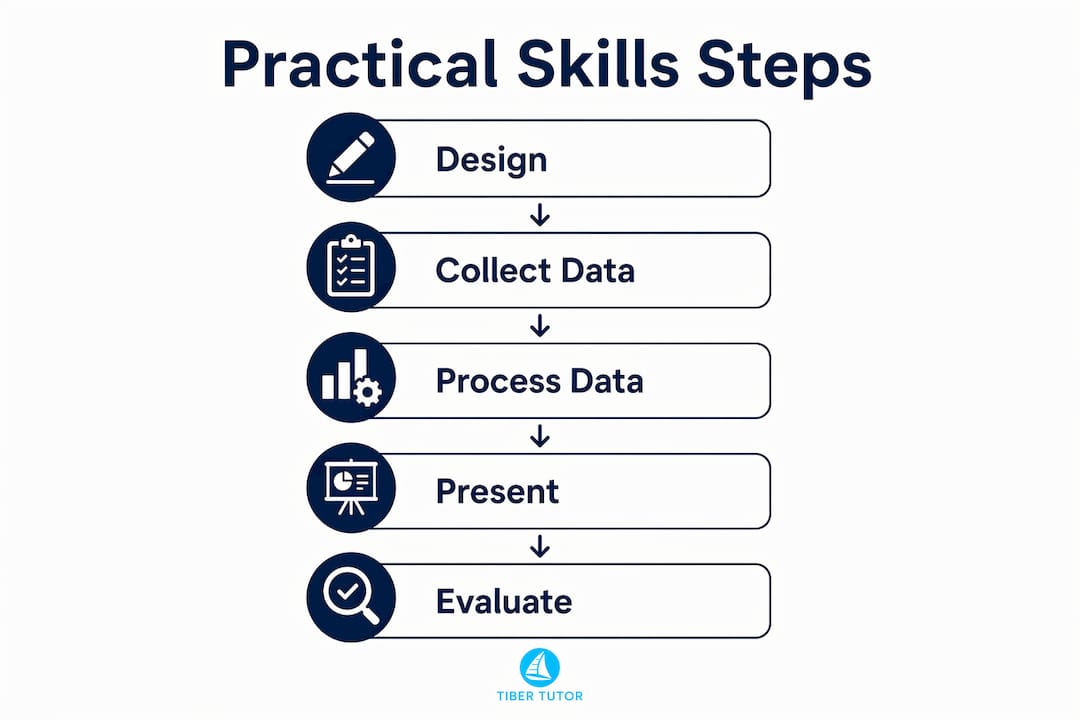
IB Biology practical skills are the core competencies students use to design investigations, handle biological data, and communicate findings with scientific accuracy. These skills appear across two major assessment components: Paper 3 and the Internal Assessment (IA). Together, they account for a significant portion of your final grade. Examiners expect you to demonstrate not just what you know, but how you think and work as a scientist. Tibertutor’s resources are built around exactly these expectations, helping you practise with exam-style questions and detailed feedback from experienced educators.
What are the key components of IB Biology practical skills explained?
Effective experimental design is the foundation of every high-scoring IB Biology investigation. Before you touch any equipment, you need to define your variables with precision.
The three variable types are independent (IV), dependent (DV), and controlled (CV). Your IV is what you deliberately change. Your DV is what you measure in response. Your CVs are everything else you keep constant, and you must state the specific tool used to control each one. Standardising controlled variables with explicit measurement details is what separates a credible protocol from a vague one.

Top-scoring designs use 5–7 levels of the independent variable with 3–5 repeats per level. That range captures the full biological response, including any plateau, and the repeats give you enough data to calculate a meaningful mean. A study investigating enzyme activity at only two or three temperatures, for example, cannot reveal where the rate peaks or declines.
Your protocol must be written as stepwise instructions with operational definitions. “Add 2 cm³ of substrate using a calibrated syringe” is a protocol instruction. “Add some substrate” is not.
Pro Tip: Justify your IV range explicitly. State that you chose pH 4–10 because it spans below and above the expected optimum, capturing the full enzyme activity curve. Examiners reward this reasoning.
| Design element | Examiner expectation |
|---|---|
| Independent variable | 5–7 levels covering the full biological range |
| Dependent variable | Measured with a named, calibrated instrument |
| Controlled variables | Each listed with the specific tool used to standardise it |
| Repeats | 3–5 per level to allow mean calculation and error analysis |
How do you collect, process, and present biological data accurately?
Raw data recording starts the moment your experiment begins. Write values directly into a table with correct units and uncertainty stated in the column header, for example “Volume (cm³ ± 0.05).” Never transcribe from rough notes later. Transcription introduces errors and examiners can tell.
Processing data means calculating means, rates, and percentages, and you must show your working. Paper 3 tests data-handling skills including mean, standard deviation, and trendline application. Standard deviation tells you how spread your repeats are. A large standard deviation signals inconsistency in your method, which you then address in your evaluation.
Graphs must have labelled axes with units, an appropriate scale, and a line of best fit or curve matched to the biological relationship. Effective data presentation uses error bars to show variability across repeats. A sigmoid curve suits population growth data. A straight line of best fit suits a linear relationship like light intensity and photosynthesis rate.
The most common error in data analysis is describing a trend without quoting numbers. High-scoring students quote specific data with units to support their biological explanations. “The rate increased” scores nothing. “The rate increased from 0.4 cm³ s⁻¹ at 20°C to 1.2 cm³ s⁻¹ at 40°C” scores marks.
Pro Tip: Match your trendline type to the biology. A curve through enzyme activity data reflects the denaturing effect above the optimum. A straight line would misrepresent the relationship and cost you marks.
What are common practical mistakes and how can evaluations improve your score?
Poor evaluations are the single biggest reason students lose marks in the IA analysis section. Vague statements like “the results were inaccurate because of human error” tell an examiner nothing. The error-effect-improvement framework gives your evaluation structure and credibility.
For each weakness, follow three steps:
- Identify the error source. State whether it is systematic (affects all readings in one direction, such as a miscalibrated balance) or random (unpredictable variation, such as timing a colour change by eye).
- Explain the effect on your data. Describe how the error skews your results. “Manual timing of colour change introduced random error, increasing the spread of repeats at each temperature.”
- Propose a specific, costed improvement. Replace manual timing with a colorimeter set to record absorbance every 10 seconds. This removes observer judgement entirely.
Detailed, costed evaluation improvements outperform vague suggestions every time. Examiners want to see that you understand why the error matters and that your solution is realistic. Saying “use better equipment” is not a solution. Saying “replace the ruler with a digital calliper (±0.01 mm) to reduce parallax error” is.
Pro Tip: Address at least two distinct error sources in your evaluation. One systematic and one random error shows examiners you understand the difference and can apply it to your specific investigation.
How do IB Biology practical skills integrate with assessment criteria?
Practical skills appear in two distinct assessment contexts, and the expectations differ between them.
In Paper 3, you respond to unfamiliar experimental scenarios. Questions test your ability to identify variables, suggest improvements, process data, and draw conclusions. The IB Biology assessment criteria for Paper 3 reward clarity, correct use of units, and scientific justification. You will not be penalised for an unexpected result, but you will be penalised for failing to explain it.
In the IA, the same practical competencies apply across five criteria: Personal Engagement, Exploration, Analysis, Evaluation, and Communication. Each criterion has a defined mark band. Exploration rewards a focused research question, a justified methodology, and a clear risk assessment. Analysis rewards correct data processing, appropriate graphs, and uncertainty propagation. For a full breakdown of IA assessment types, the structure of each criterion is covered in detail.
The key difference between Paper 3 and the IA is depth. Paper 3 answers are concise and targeted. IA write-ups require full scientific argumentation, with every methodological choice justified and every conclusion linked back to the data. Practising both formats builds the flexibility you need for a strong overall grade. Students preparing for IB Environmental Systems and Societies will find that IA scoring strategies follow similar principles across IB science subjects.
Key takeaways
Mastering IB Biology practical skills requires precise experimental design, rigorous data handling, and structured evaluation using the error-effect-improvement framework.
| Point | Details |
|---|---|
| Variable definition | State IV, DV, and each CV with the specific measurement tool used. |
| Experimental design | Use 5–7 IV levels and 3–5 repeats per level for reliable, meaningful data. |
| Data presentation | Label axes with units, include error bars, and quote specific values in conclusions. |
| Evaluation quality | Apply the error-effect-improvement framework with costed, specific suggestions. |
| Assessment alignment | Practise both Paper 3 data-handling questions and full IA write-ups to build range. |
What I’ve learnt from watching students tackle biology practicals
The gap between a student who scores well in practicals and one who struggles rarely comes down to laboratory skill. It comes down to language precision and structural thinking.
Students who write “the enzyme worked better at higher temperatures” and students who write “the rate of hydrolysis increased by 0.8 cm³ s⁻¹ between 30°C and 40°C, consistent with increased kinetic energy of substrate molecules” have often done the same experiment. The second student scores. The first does not.
The other pattern I see repeatedly is students treating the evaluation as an afterthought. They spend weeks perfecting their method and then write three lines about “human error” at the end. The evaluation is where you demonstrate scientific maturity. It is where examiners see whether you understand the limits of your own investigation. Spend as much time on your evaluation as you do on your analysis.
For educators, the most effective approach is to model the error-effect-improvement framework explicitly before students attempt their own evaluations. Show them a weak evaluation and a strong one side by side. The difference becomes obvious immediately, and students internalise the standard far faster than they do from written instructions alone.
— Oliver
Tibertutor’s resources for IB Biology practical mastery
Tibertutor is built by IB examiners and experienced educators who understand exactly what assessors look for in practical work. The platform offers exam-style questions covering experimental design, data analysis, and evaluation, all mapped to the current IB Biology syllabus.

Students preparing for Paper 3 or working through their IA will find topic-specific tests, detailed mark schemes, and animated videos that break down practical techniques step by step. Progress tracking shows you precisely where your data-handling or evaluation skills need attention. Visit the IB Science questionbank to access the full suite of resources, or explore the student resources page for a structured study plan tailored to your current stage of preparation.
FAQ
What practical skills does IB Biology assess?
IB Biology assesses the ability to design experiments, collect and process data, and evaluate methodology. These skills are tested in Paper 3 and across all five IA criteria.
How many repeats does an IB Biology experiment need?
Top-scoring designs use 3–5 repeats per level of the independent variable. This allows you to calculate a reliable mean and identify random error in your data.
What is the error-effect-improvement framework?
The error-effect-improvement framework requires you to name an error source, explain how it affects your data, and propose a specific, realistic improvement. Vague references to “human error” do not meet this standard.
How does Paper 3 differ from the IA in practical skills?
Paper 3 tests practical skills through short, targeted questions on unfamiliar experiments. The IA requires full scientific argumentation across five criteria, with every methodological choice justified in writing.
Why do students lose marks in data analysis?
Students most commonly lose marks by describing trends without quoting specific values and units. Examiners require numerical evidence to award marks for data interpretation.